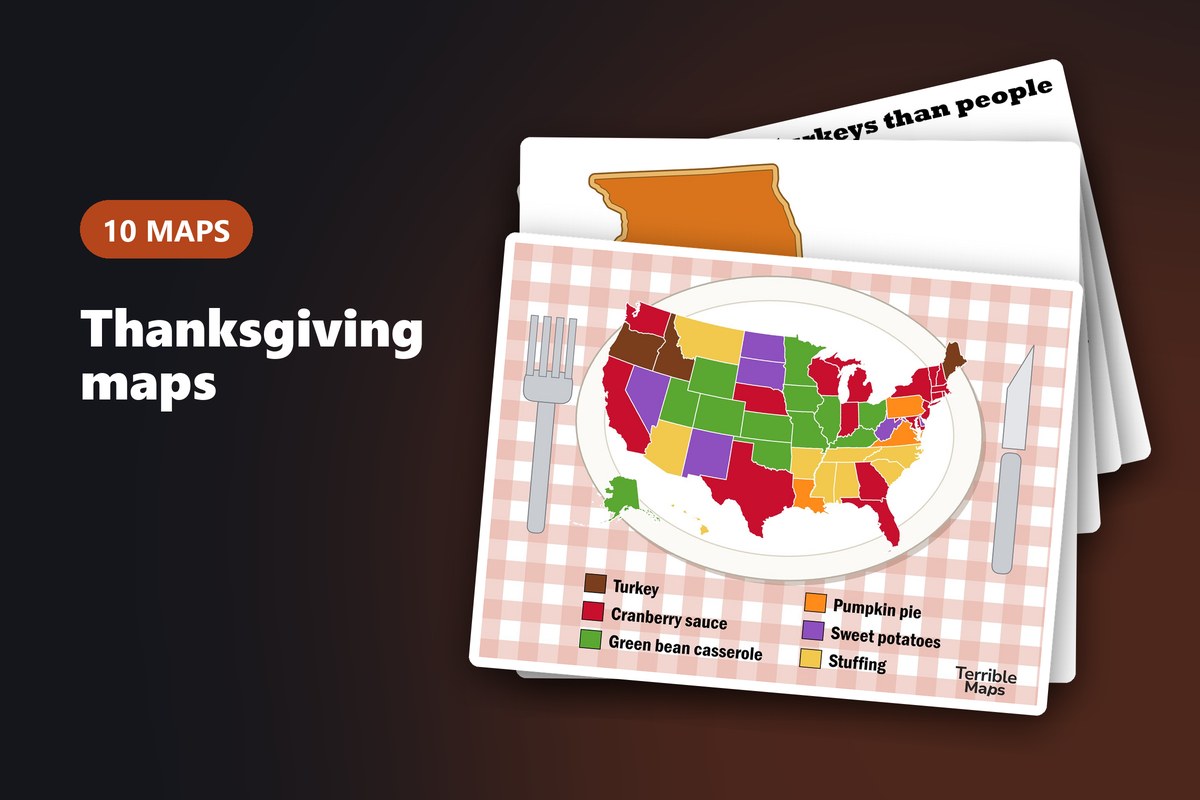
Everything about Thanksgiving that fits on a map: who else celebrates it, why it’s on a Thursday, which states have more turkeys than people, where the pumpkins and cranberries really come from, and the dish each state hates the most.
Which countries celebrate Thanksgiving?
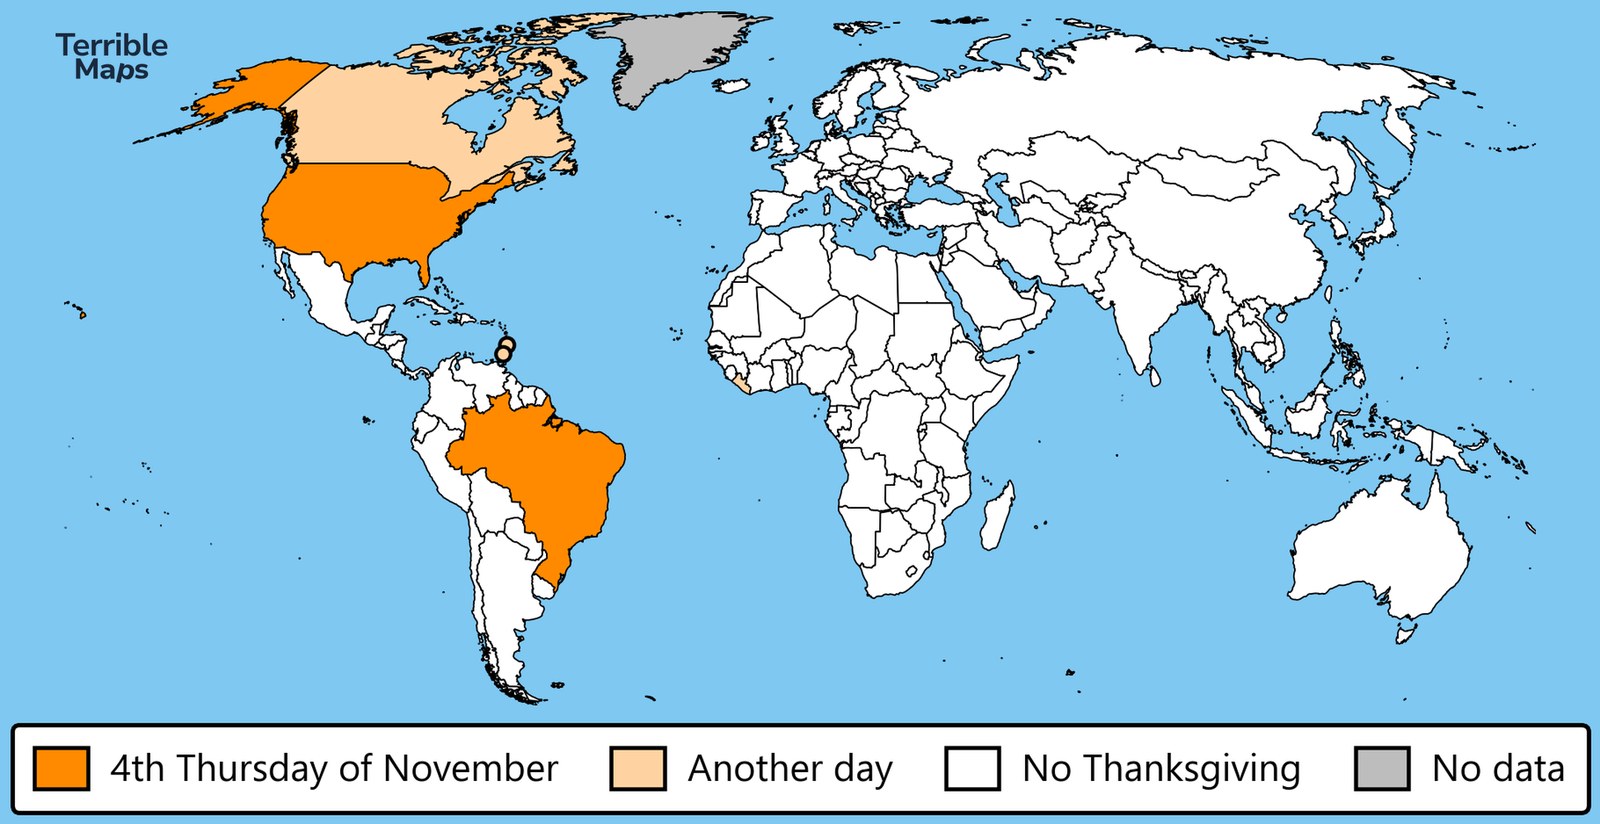
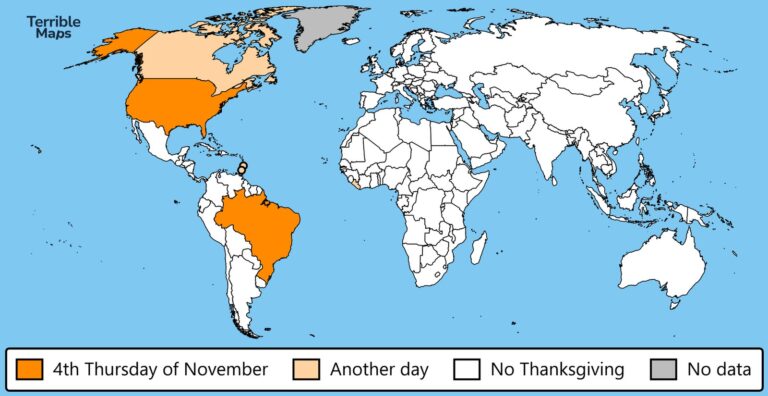
The United States, Canada, Liberia, Saint Lucia, Grenada and Australia’s Norfolk Island all have a Thanksgiving holiday, and Brazil has an official one on the same Thursday as the US that most Brazilians don’t celebrate. Norfolk Island’s comes from visiting American whalers and falls on the last Wednesday of November, so this year it gets there a day before America does.
This map has its own post: Countries with Thanksgiving on the 4th Thursday of November.
Sources: Wikipedia on Thanksgiving, Brazil, Law 5,110 of 1966, Liberia, Ministry of Information, timeanddate.com on Saint Lucia, Wikipedia on public holidays in Grenada and Norfolk Island tourism.
| Country | Thanksgiving | In 2026 |
|---|---|---|
| Saint Lucia | First Monday in October | 5 October |
| Canada | Second Monday in October | 12 October |
| Grenada | 25 October, marking the US-led intervention of 1983 | 25 October |
| Liberia | First Thursday in November | 5 November |
| Norfolk Island (Australia) | Last Wednesday in November | 25 November |
| United States | Fourth Thursday in November | 26 November |
| Brazil | Fourth Thursday in November (official, little celebrated) | 26 November |
Why is Thanksgiving on a Thursday?
Because the early colonial days of thanks tended to fall on Thursdays, and the presidents kept it that way. George Washington asked for Thursday 26 November 1789, and in 1863 Abraham Lincoln set the last Thursday of November, after a letter-writing campaign by Sarah Josepha Hale. Franklin D. Roosevelt moved it a week earlier in 1939 to give the shops longer before Christmas, and in 1941 Congress fixed it to the fourth Thursday.
Sources: TIME, The Real Reason Why Thanksgiving Is Always on a Thursday and National Park Service, Lincoln and Thanksgiving.
Where each country thinks the turkey is from
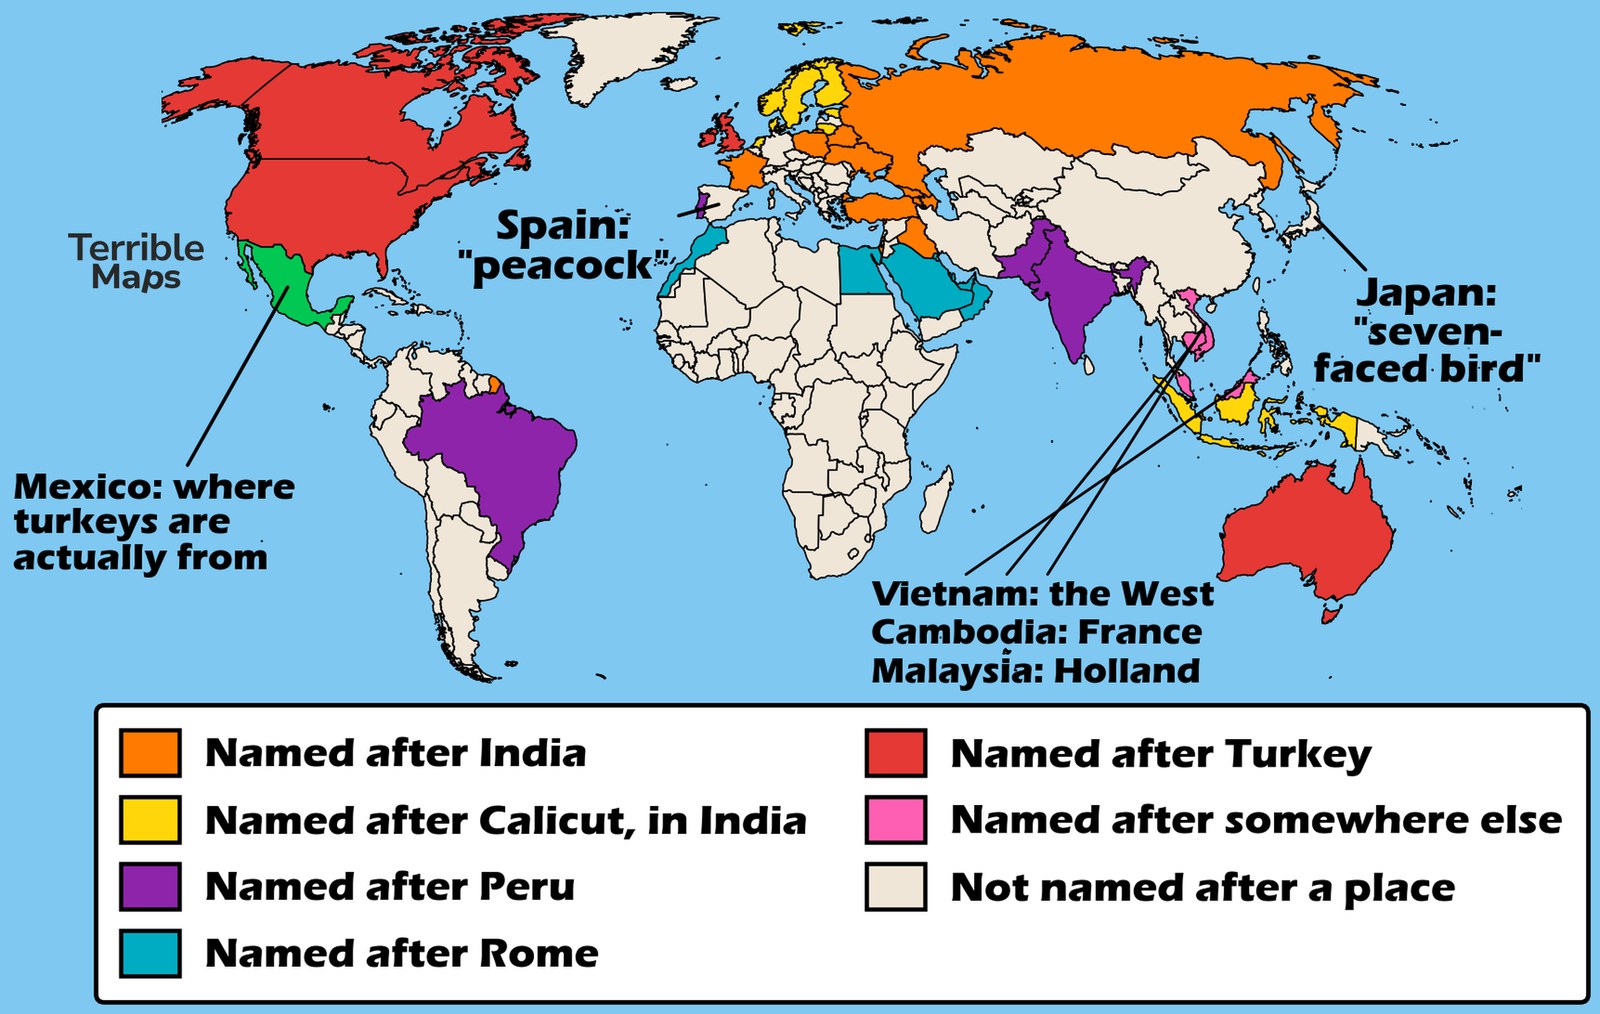
The turkey comes from North America, but almost no language says so. English named it after Turkey, Turkish named it after India, Portuguese calls it peru, after the country, and Arabic speakers in Egypt and the Gulf call it the Roman rooster.
This map has its own post: Where each country thinks the turkey is from.
Sources: Wiktionary’s translations of turkey and Wikipedia on the turkey.
Countries that pardon a turkey every Thanksgiving
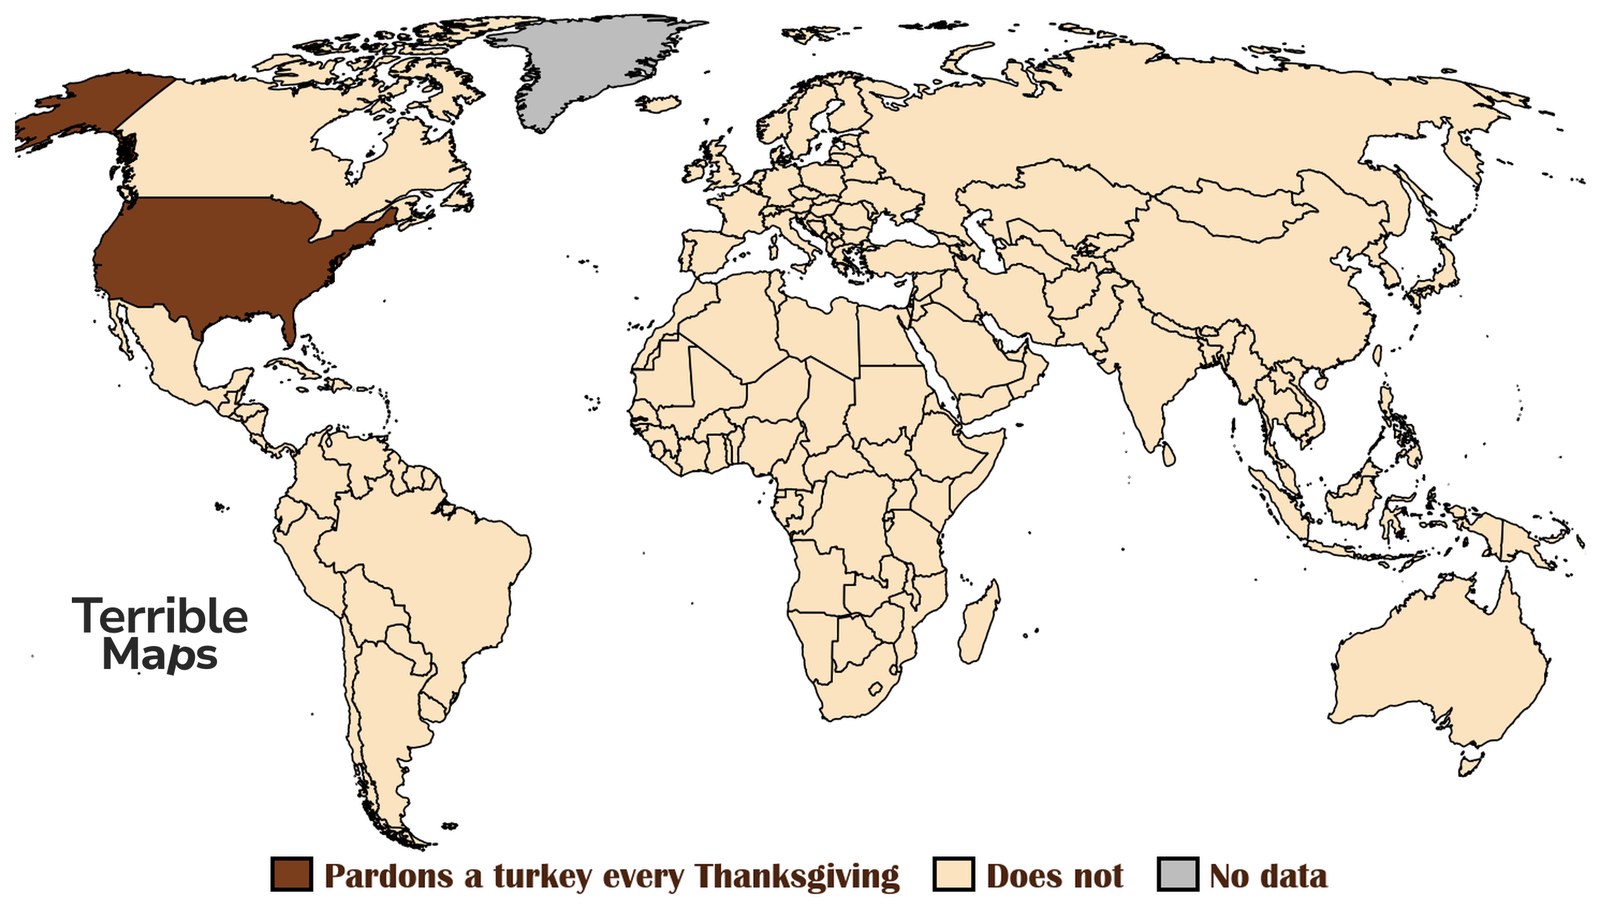
The United States is the only country that pardons a turkey every year, and has done since George H. W. Bush made it a fixture in 1989. The birds usually spend the night before the ceremony at the Willard hotel in Washington, which is more than most turkeys get, and then retire to a park or a university. I couldn’t find another country that does it, and that includes Turkey.
Source: Wikipedia on the National Thanksgiving Turkey Presentation.
States with more turkeys than people
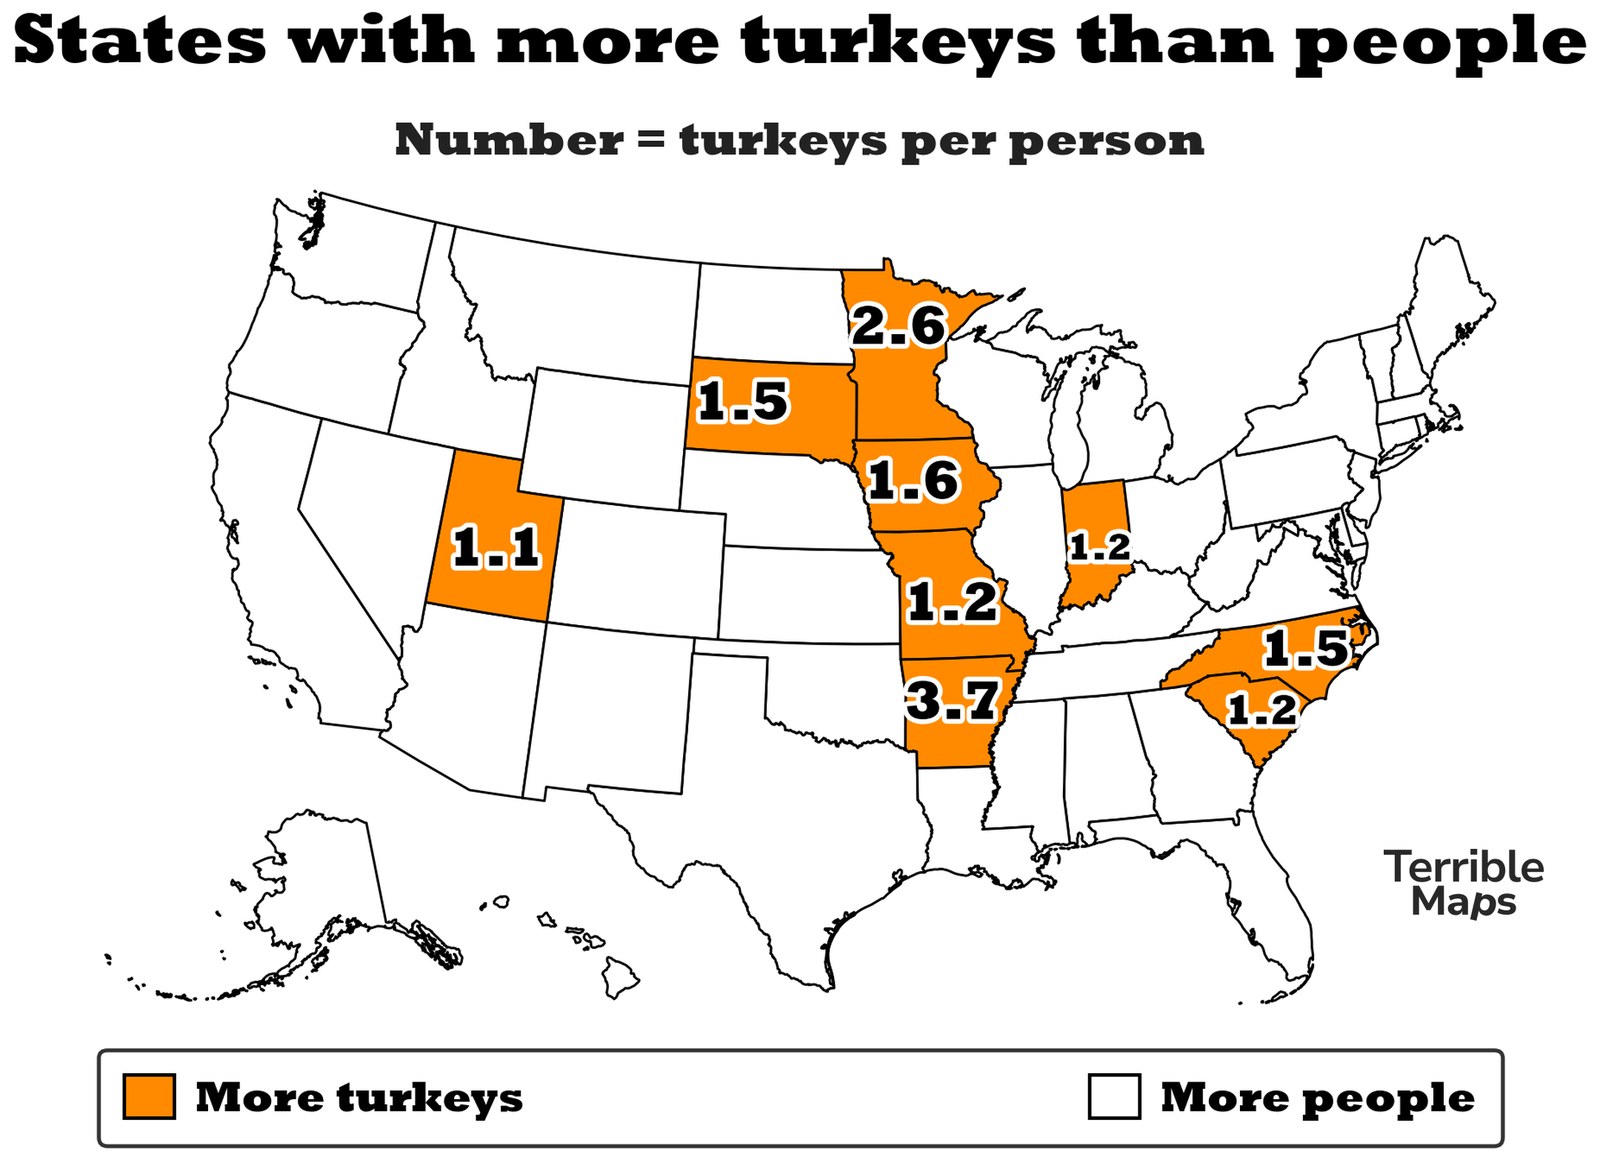
Nine states have more turkeys than people. Arkansas has 3.7 turkeys for every person and Minnesota 2.6, while North Carolina has the most turkeys of any state, 15.7 million, but also 10.7 million people to share them with.
Sources: USDA 2022 Census of Agriculture (turkey inventory) and US Census Bureau 2024 population estimates. USDA doesn’t publish Nebraska’s or New York’s figure, to protect individual farms.
| State | Turkeys per person |
|---|---|
| Arkansas | 3.74 |
| Minnesota | 2.61 |
| Iowa | 1.58 |
| South Dakota | 1.52 |
| North Carolina | 1.47 |
See all 50 states
| South Carolina | 1.24 |
| Indiana | 1.24 |
| Missouri | 1.16 |
| Utah | 1.07 |
| West Virginia | 0.70 |
| Virginia | 0.64 |
| North Dakota | 0.64 |
| Wisconsin | 0.40 |
| Ohio | 0.26 |
| Pennsylvania | 0.21 |
| Michigan | 0.20 |
| Kentucky | 0.15 |
| Kansas | 0.13 |
| Oklahoma | 0.08 |
| Illinois | 0.08 |
| California | 0.06 |
| Maryland | 0.02 |
| Texas | 0.01 |
| Montana | 0.01 |
| Rhode Island | 0.01 |
| Vermont | 0.01 |
| New Mexico | 0.01 |
| Maine | 0.01 |
| Alabama | 0.00 |
| New Jersey | 0.00 |
| New Hampshire | 0.00 |
| Idaho | 0.00 |
| Massachusetts | 0.00 |
| Wyoming | 0.00 |
| Delaware | 0.00 |
| Oregon | 0.00 |
| Colorado | 0.00 |
| Alaska | 0.00 |
| Connecticut | 0.00 |
| Mississippi | 0.00 |
| Washington | 0.00 |
| Tennessee | 0.00 |
| Georgia | 0.00 |
| Louisiana | 0.00 |
| Nevada | 0.00 |
| Florida | 0.00 |
| Arizona | 0.00 |
| Hawaii | 0.00 |
| Nebraska | Not published |
| New York | Not published |
Each state’s most hated Thanksgiving dish
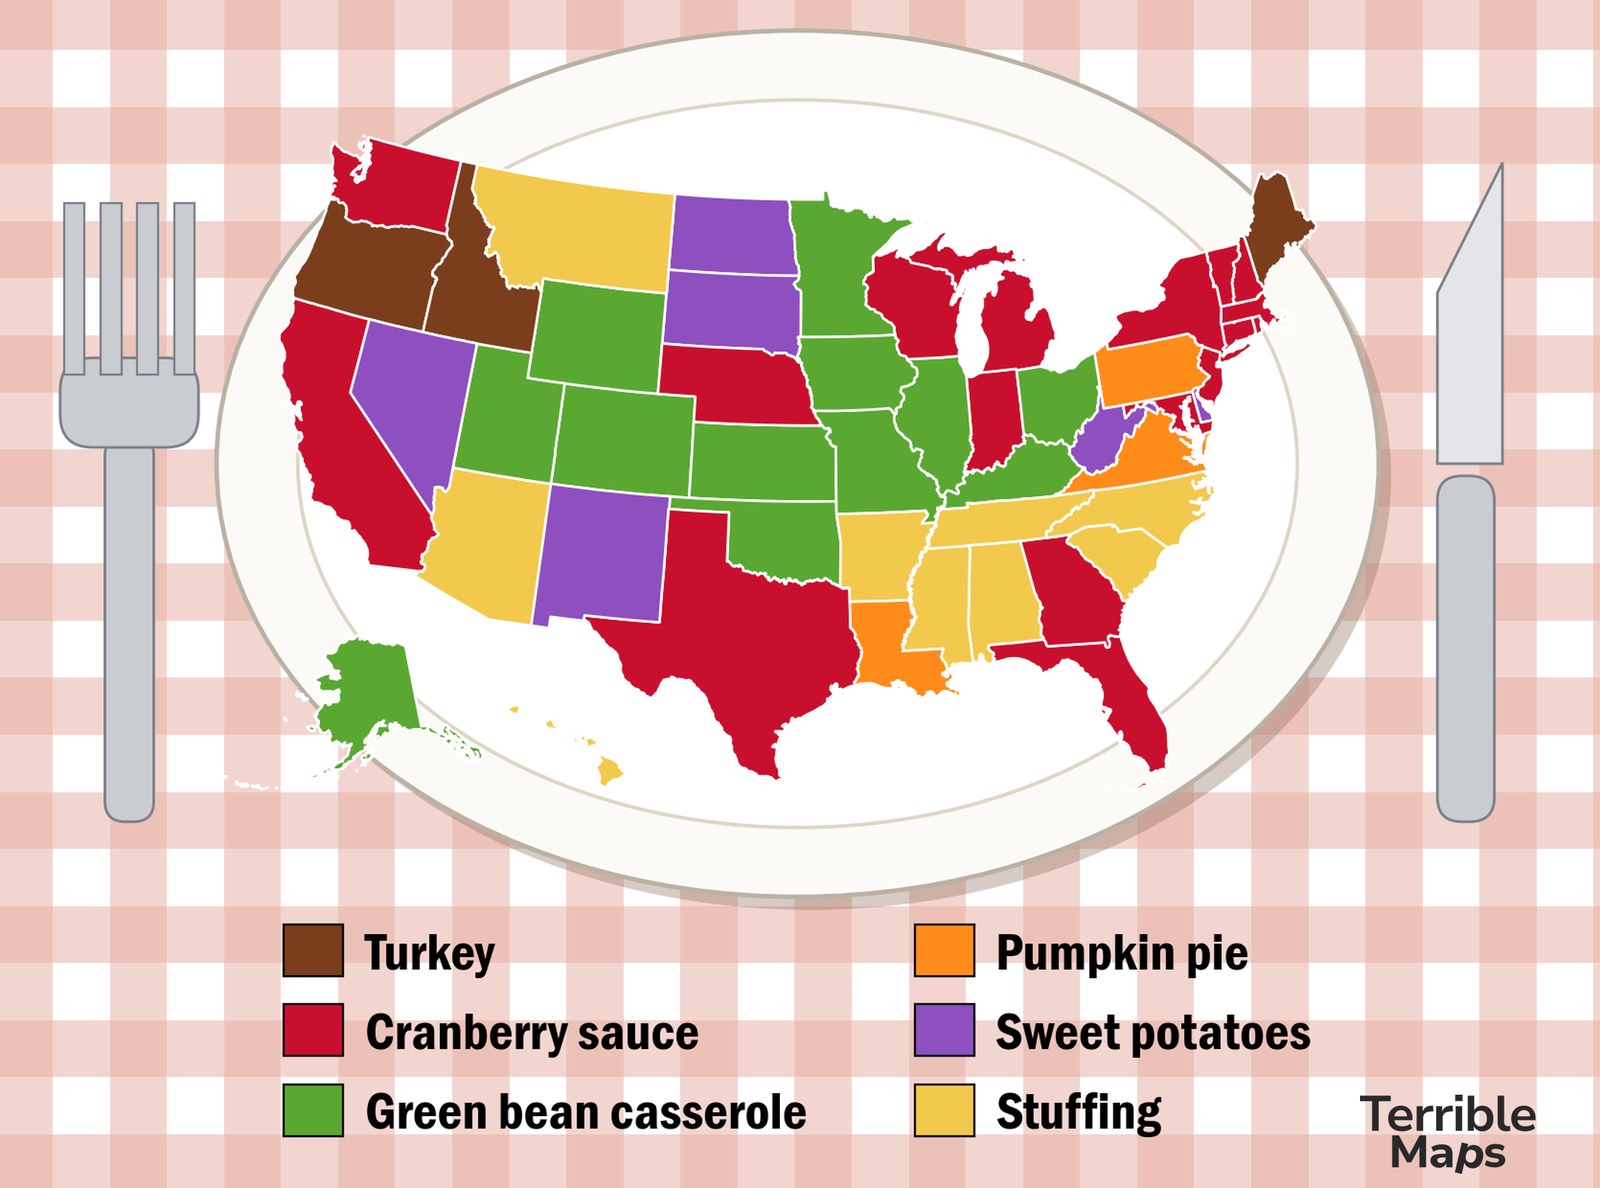
Cranberry sauce is the most hated Thanksgiving dish in 17 states and green bean casserole in 12, which is going by more than 50,000 tweets from people saying they hated one. Maine, Oregon and Idaho hate the turkey, which makes for a short Thanksgiving, and Louisiana, Virginia and Pennsylvania would like you to stop bringing pumpkin pie.
Source: The Daring Kitchen’s 2019 study of more than 50,000 geotagged tweets.
| State | Most hated dish |
|---|---|
| Alabama | Stuffing |
| Alaska | Green bean casserole |
| Arizona | Stuffing |
| Arkansas | Stuffing |
| California | Cranberry sauce |
See all 50 states
| Colorado | Green bean casserole |
| Connecticut | Cranberry sauce |
| Delaware | Sweet potatoes |
| Florida | Cranberry sauce |
| Georgia | Cranberry sauce |
| Hawaii | Stuffing |
| Idaho | Turkey |
| Illinois | Green bean casserole |
| Indiana | Cranberry sauce |
| Iowa | Green bean casserole |
| Kansas | Green bean casserole |
| Kentucky | Green bean casserole |
| Louisiana | Pumpkin pie |
| Maine | Turkey |
| Maryland | Cranberry sauce |
| Massachusetts | Cranberry sauce |
| Michigan | Cranberry sauce |
| Minnesota | Green bean casserole |
| Mississippi | Stuffing |
| Missouri | Green bean casserole |
| Montana | Stuffing |
| Nebraska | Cranberry sauce |
| Nevada | Sweet potatoes |
| New Hampshire | Cranberry sauce |
| New Jersey | Cranberry sauce |
| New Mexico | Sweet potatoes |
| New York | Cranberry sauce |
| North Carolina | Stuffing |
| North Dakota | Sweet potatoes |
| Ohio | Green bean casserole |
| Oklahoma | Green bean casserole |
| Oregon | Turkey |
| Pennsylvania | Pumpkin pie |
| Rhode Island | Cranberry sauce |
| South Carolina | Stuffing |
| South Dakota | Sweet potatoes |
| Tennessee | Stuffing |
| Texas | Cranberry sauce |
| Utah | Green bean casserole |
| Vermont | Cranberry sauce |
| Virginia | Pumpkin pie |
| Washington | Cranberry sauce |
| West Virginia | Sweet potatoes |
| Wisconsin | Cranberry sauce |
| Wyoming | Green bean casserole |
Where the pumpkins for pumpkin pie are grown
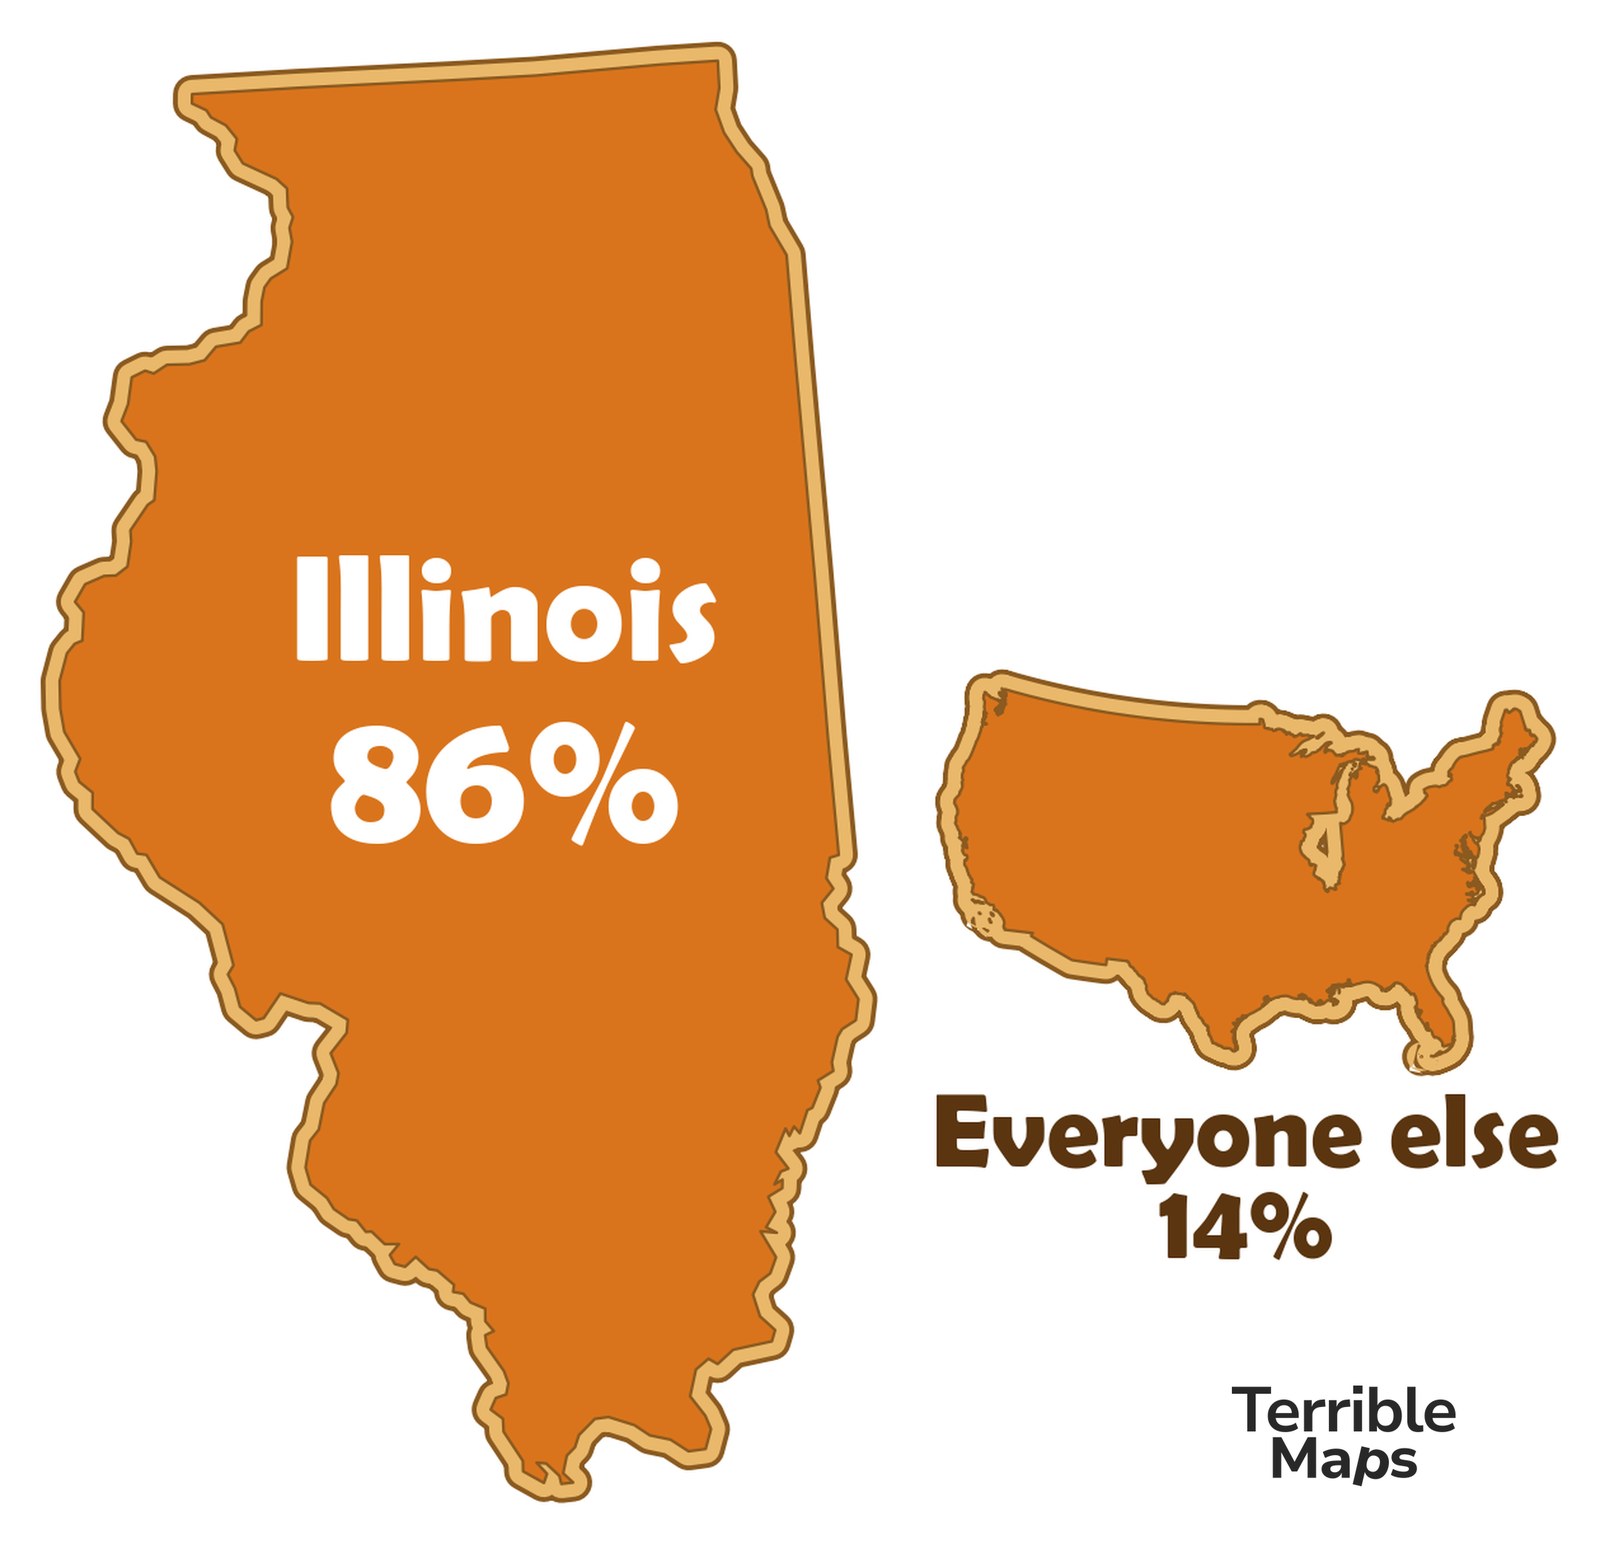
Illinois grows 86% of the pumpkins America grows for processing, so here it’s drawn at 86% of the size of the lower 48 and everyone else gets the small pie. Morton, Illinois, home of the Libby’s cannery, supplies up to 95% of the canned pumpkin in the country, so if your pie came out of a tin, it almost certainly came from here.
Sources: USDA 2022 Census of Agriculture (processing pumpkins, acres harvested: Illinois 12,870 of 14,969) and St. Louis Public Radio, 4 November 2024.
| State | Acres of pie pumpkins |
|---|---|
| Illinois | 12,870 |
| North Carolina | 452 |
| Pennsylvania | 163 |
| Texas | 154 |
| New York | 144 |
See all 32 states
| Kentucky | 80 |
| Virginia | 59 |
| Ohio | 59 |
| Washington | 58 |
| New Jersey | 45 |
| Vermont | 22 |
| Idaho | 16 |
| Mississippi | 15 |
| Massachusetts | 15 |
| Utah | 14 |
| Missouri | 12 |
| West Virginia | 12 |
| Indiana | 10 |
| New Hampshire | 10 |
| Maine | 9 |
| Nebraska | 9 |
| Colorado | 8 |
| South Dakota | 3 |
| Connecticut | 2 |
| New Mexico | 1 |
| Minnesota | 1 |
| Alaska | 1 |
| Louisiana | 1 |
| Arizona | 1 |
| North Dakota | 1 |
| Montana | 1 |
| Oklahoma | 1 |
Acres of pumpkins per 1,000 people
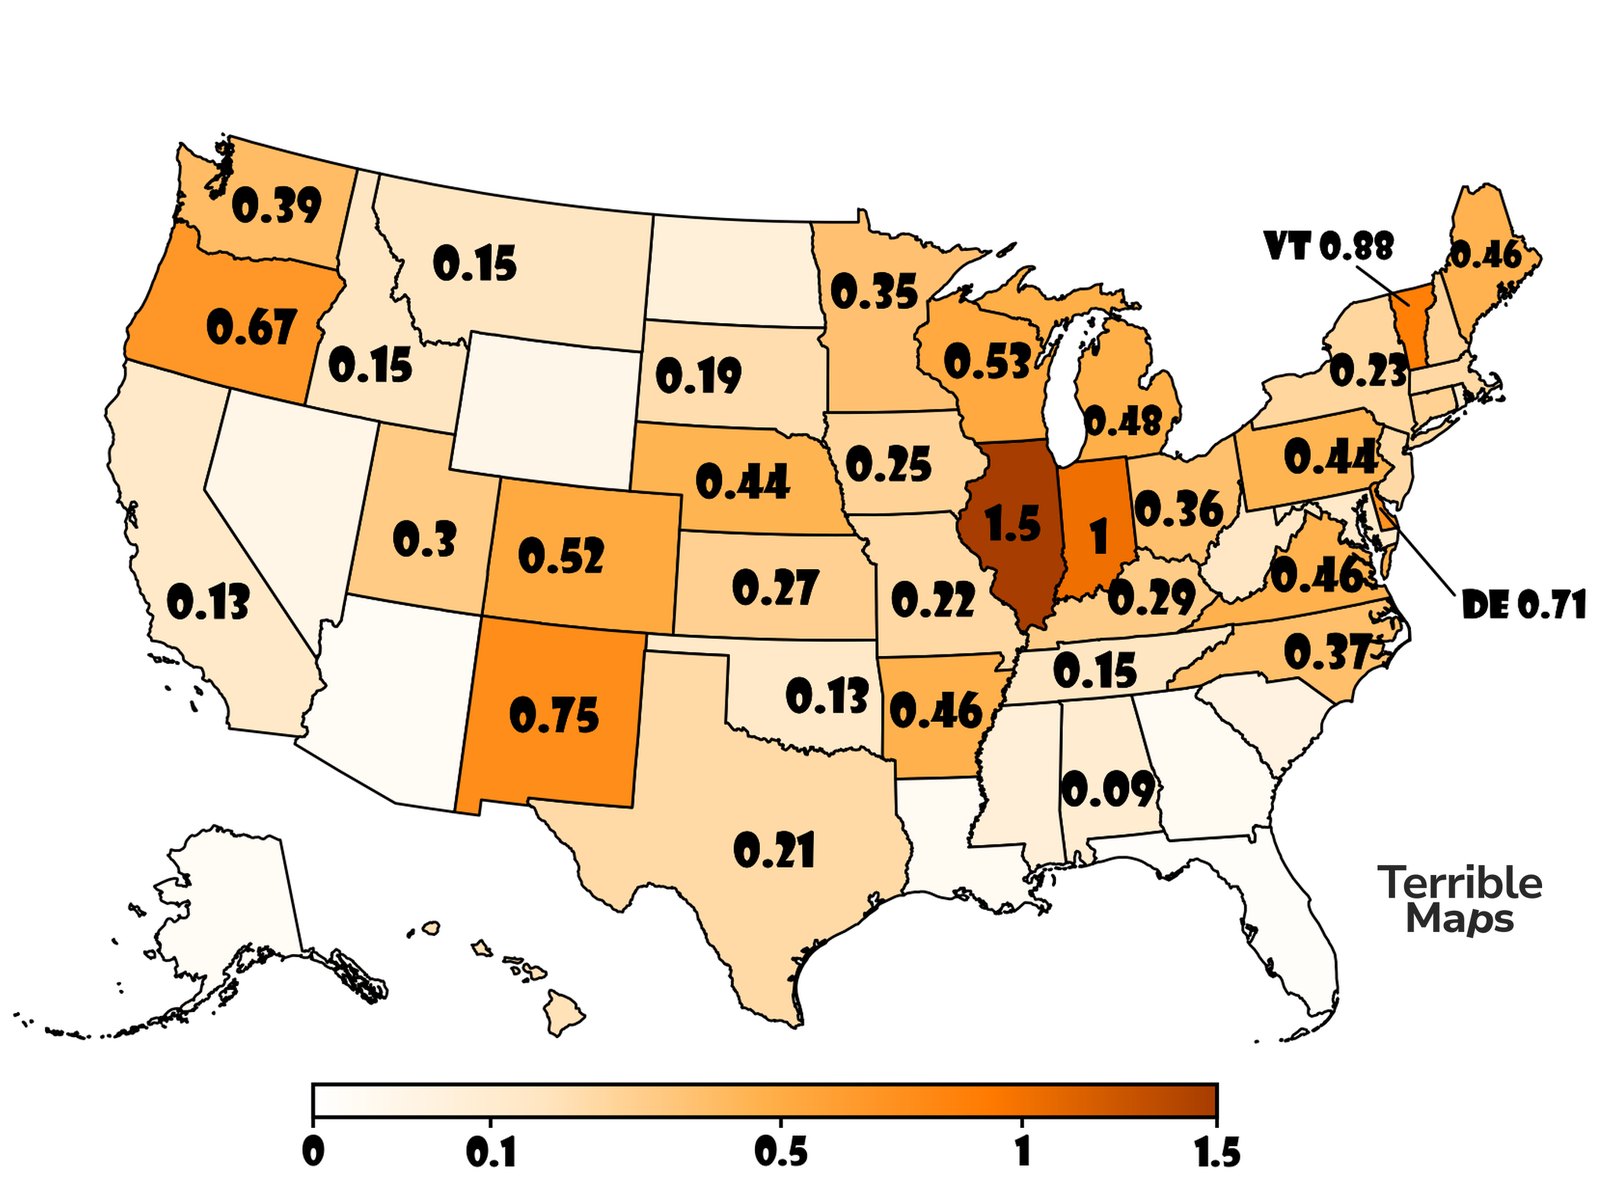
Counting every kind of pumpkin, Illinois still grows the most for its size, about 1.5 acres for every 1,000 people. The numbers for every state are with the Halloween maps, where this one first appeared.
Sources: USDA 2022 Census of Agriculture (pumpkin acres harvested) and US Census Bureau 2024 population estimates.
Acres of cranberry bogs in each state
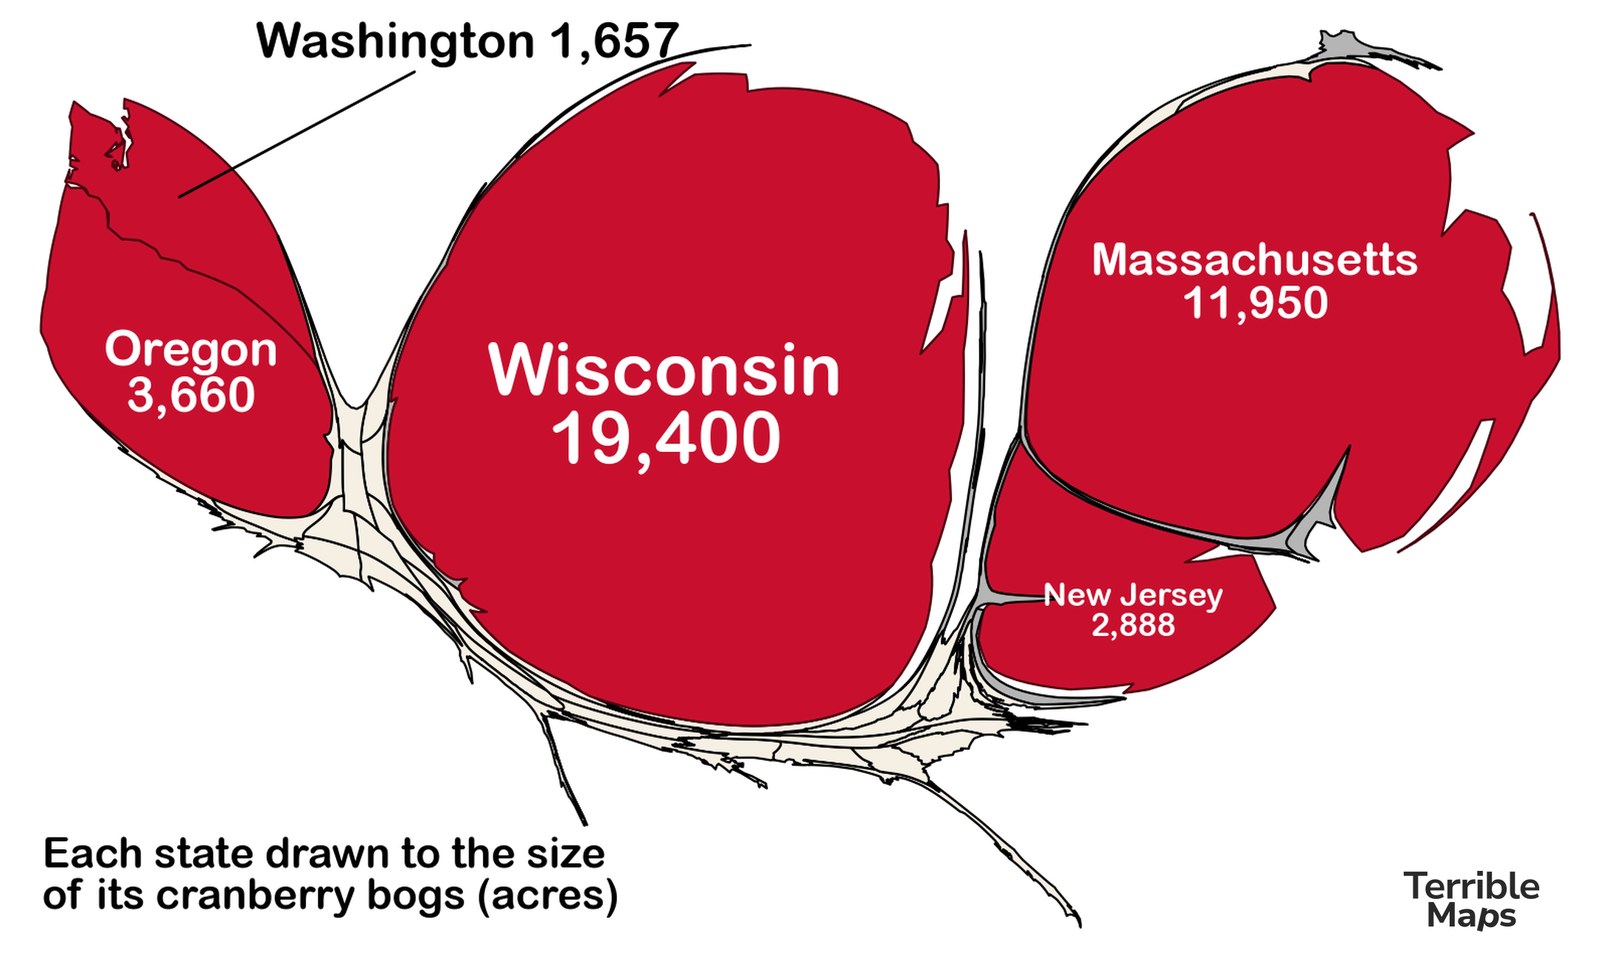
Every state here is drawn to the size of its cranberry bogs, which is why most of the country has shrunk to a thin string between them. Wisconsin has 19,400 acres, 48% of the national total, and the state famous for cranberries, Massachusetts, comes second with 11,950. States with no bogs are drawn as if they had 100 acres each, or they’d disappear.
Source: USDA 2022 Census of Agriculture (cranberries, acres bearing). USDA doesn’t publish the figure for Maine, Michigan, Minnesota, New York, Pennsylvania, Connecticut, Rhode Island or Delaware, so those are drawn small and grey.
| State | Acres of cranberry bogs | Share of US |
|---|---|---|
| Wisconsin | 19,400 | 48% |
| Massachusetts | 11,950 | 30% |
| Oregon | 3,660 | 9% |
| New Jersey | 2,888 | 7% |
| Washington | 1,657 | 4% |
The more of a state’s farms keep turkeys, the more of them grow peaches
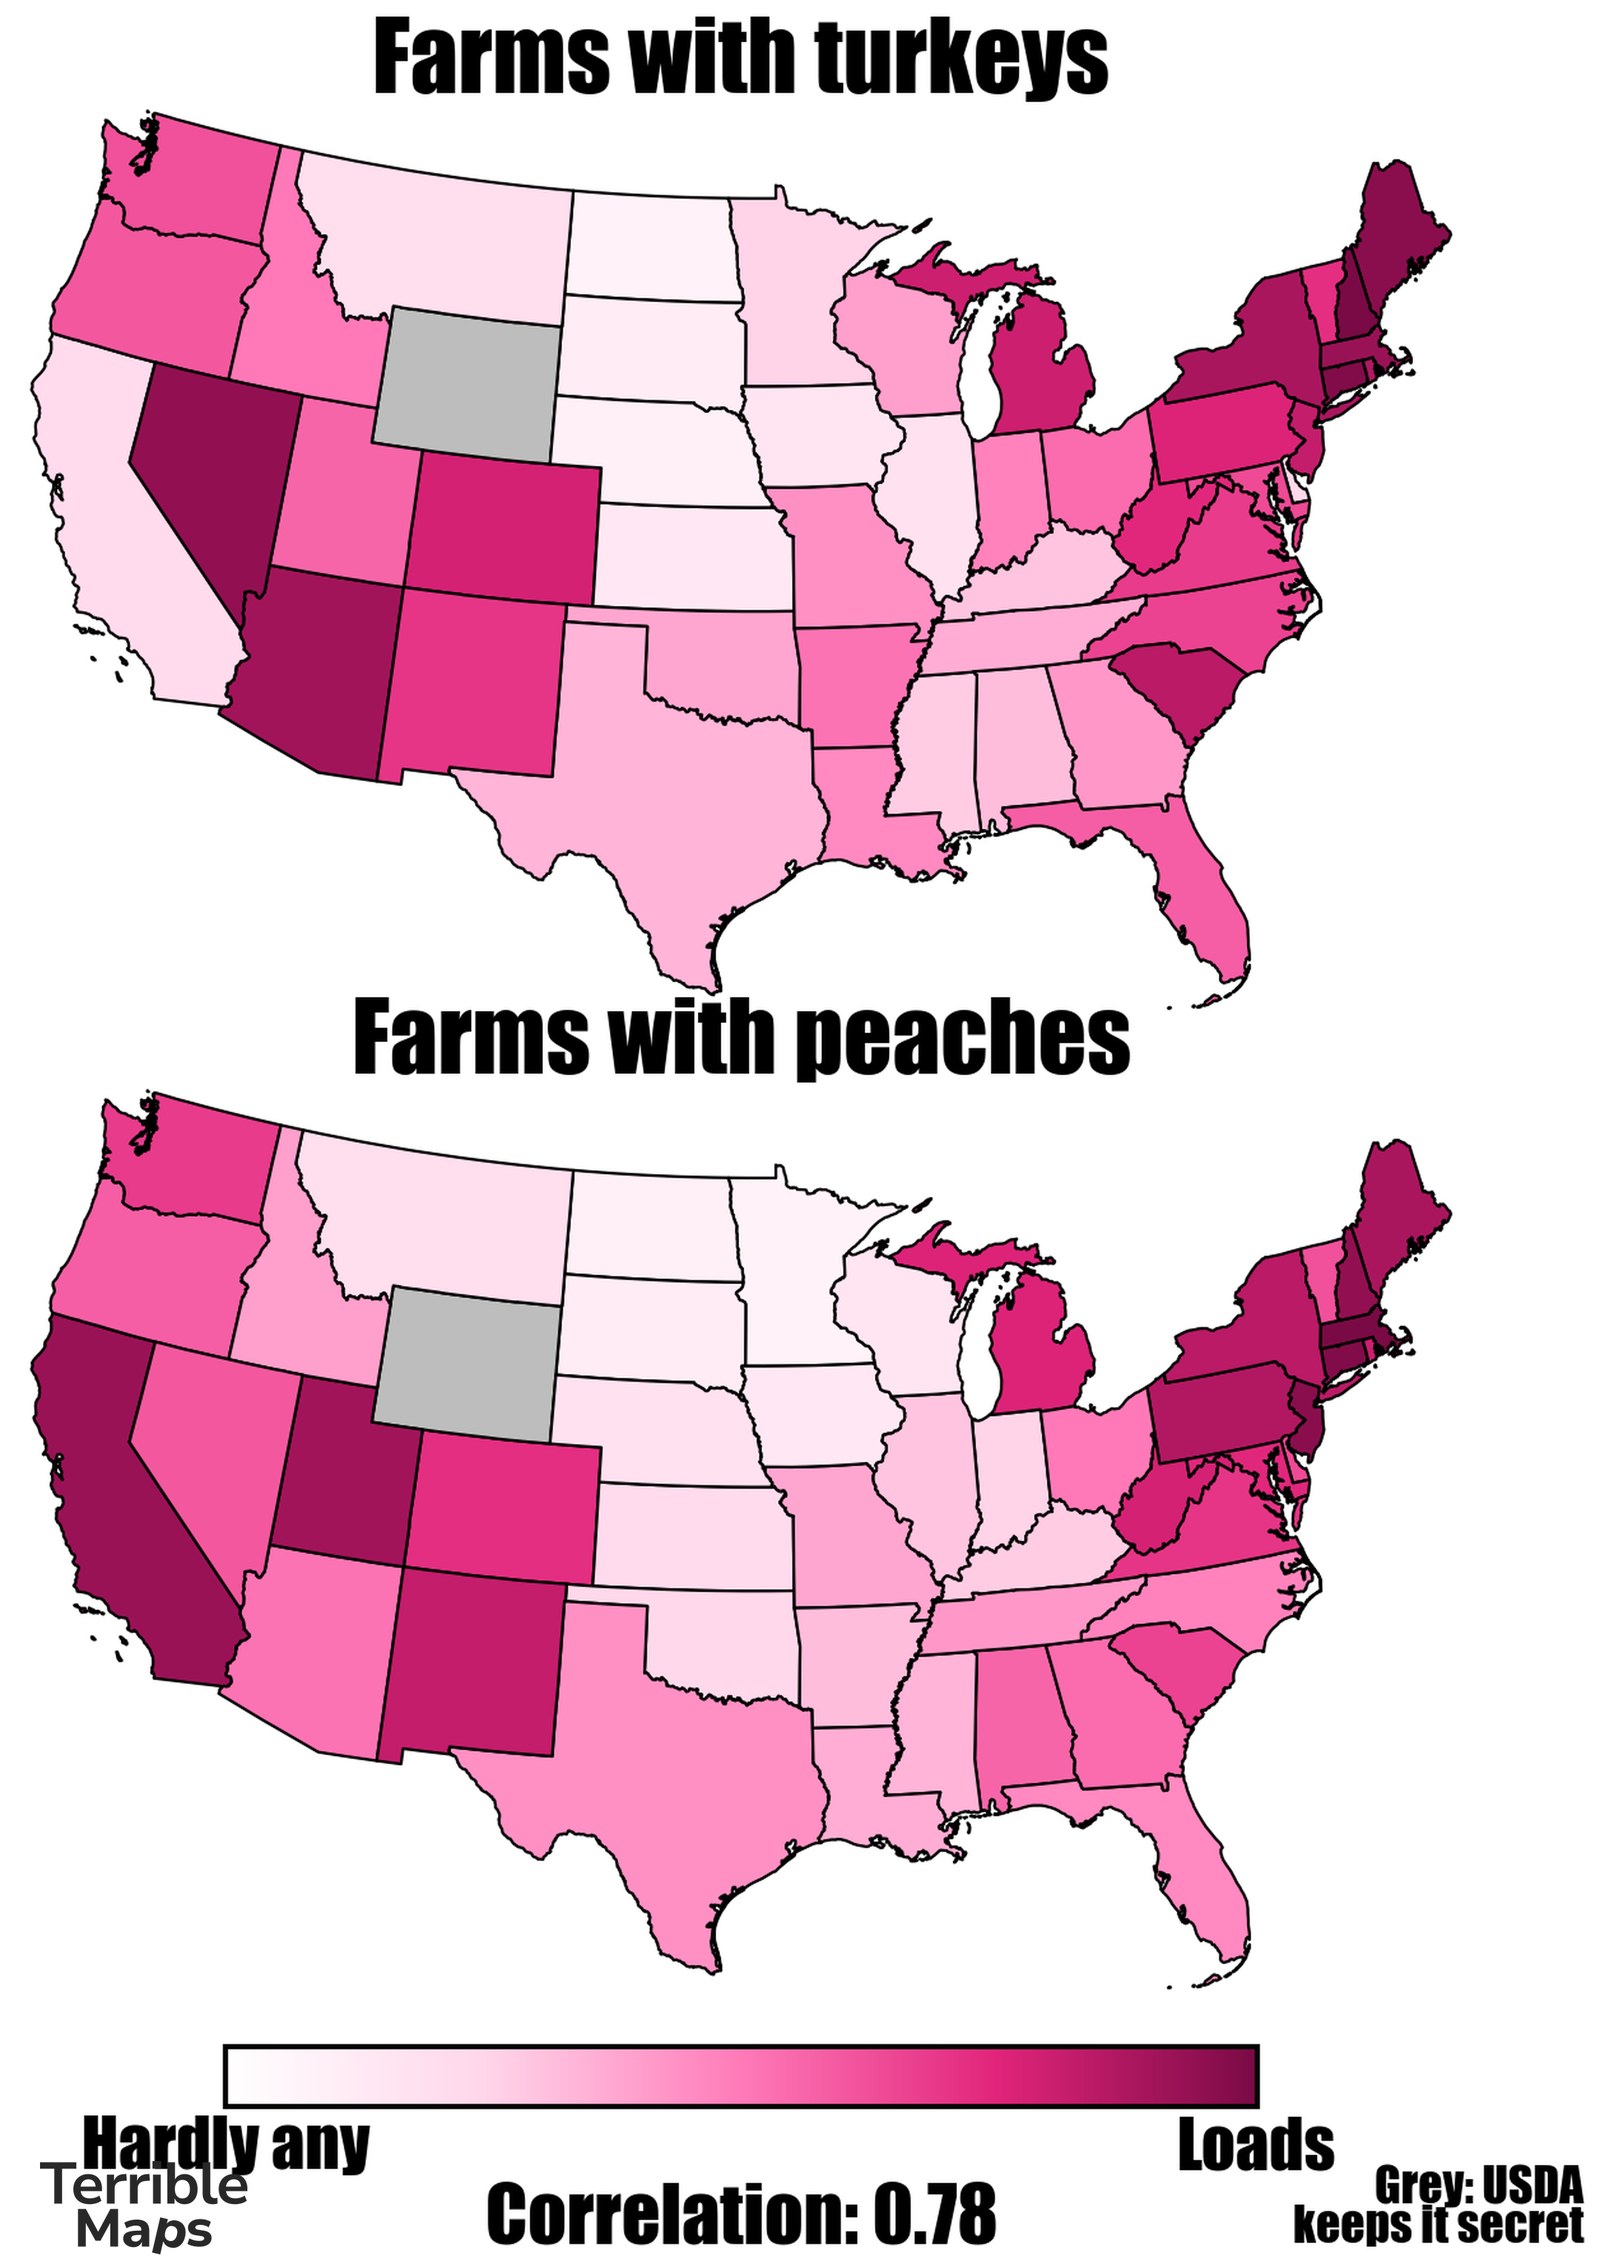
The states where more farms keep turkeys are also the states where more farms grow peaches, with a correlation of 0.78. It doesn’t mean turkeys need peaches, or the other way round. It’s what happens when you put enough maps next to each other.
Source: USDA 2022 Census of Agriculture (share of each state’s farms with each one; rank correlation over the lower 48, Wyoming’s peach figure isn’t published).
The more of a state’s farms milk cows, the more of them grow pumpkins
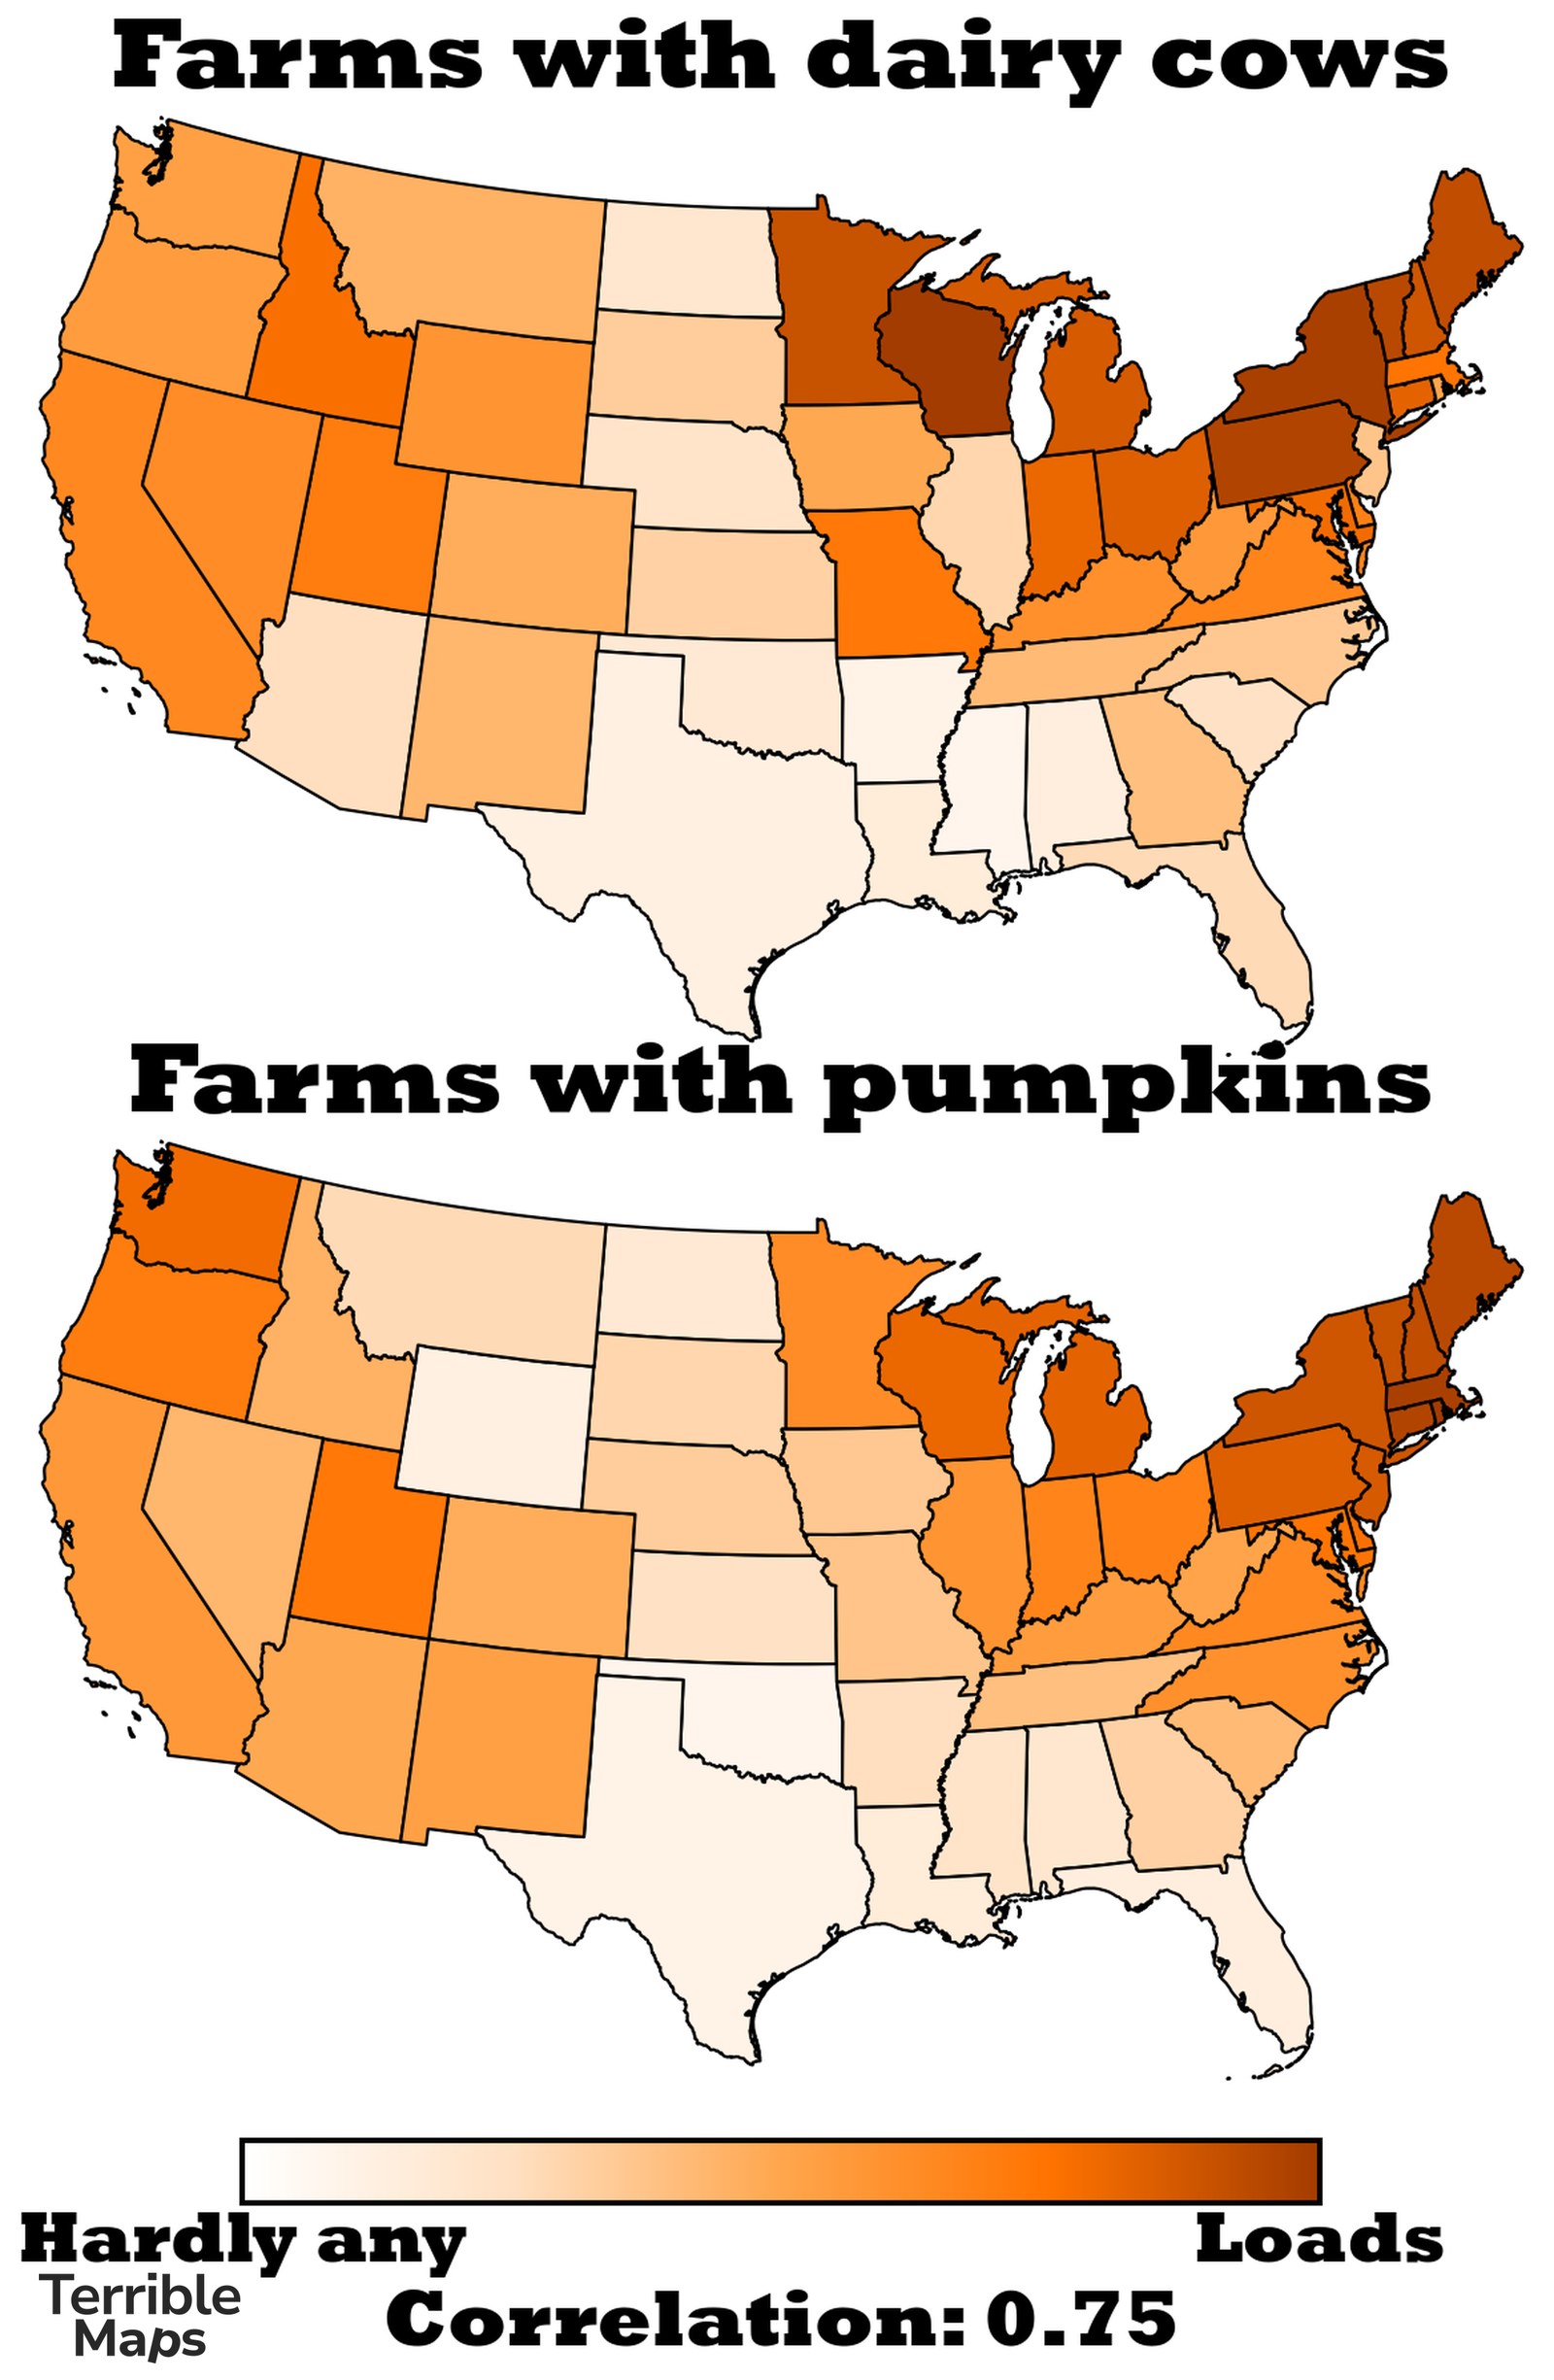
Same again: the more of a state’s farms milk cows, the more of them grow pumpkins, with a correlation of 0.75. Pumpkin pie does need milk, but I don’t think that’s why.
Source: USDA 2022 Census of Agriculture (share of each state’s farms with each one; rank correlation over the lower 48).
Share these maps
More from Terrible Maps
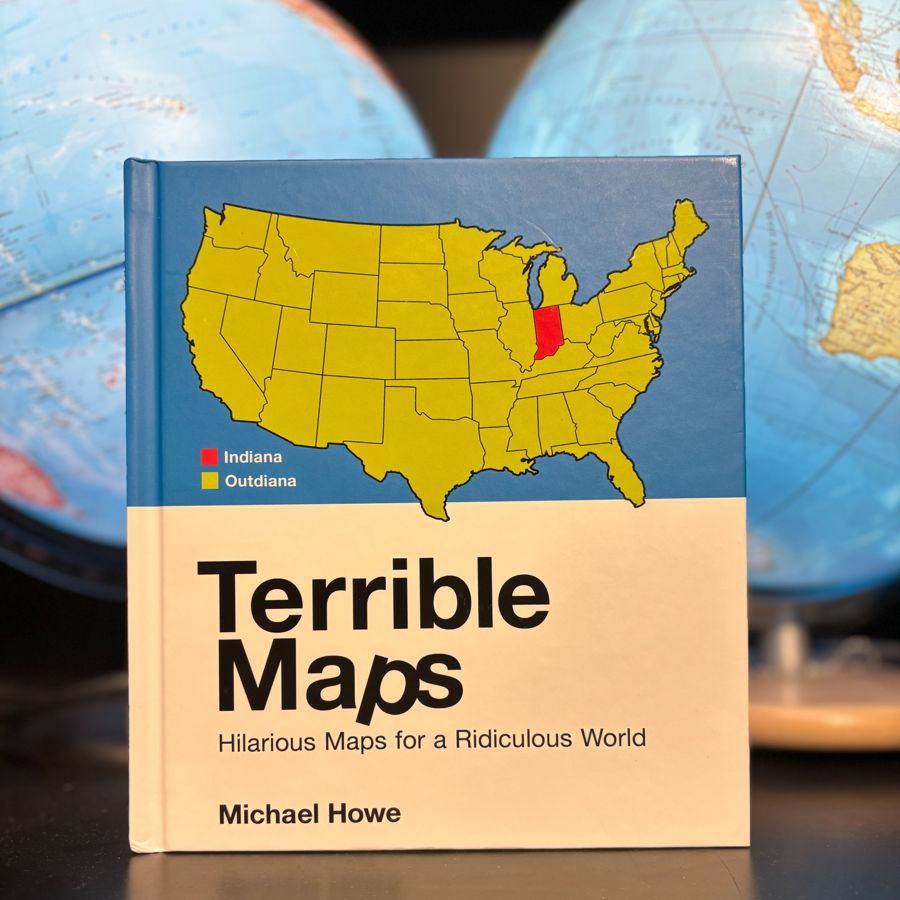 The bookTerrible Maps: Hilarious Maps for a Ridiculous WorldOut now in the UK, US, Canada and Australia.
 The shopShirts, hoodies, mugs and printsIncluding the Africa / Asia T-shirt.
There’s a new terrible map most days on Facebook and Instagram.